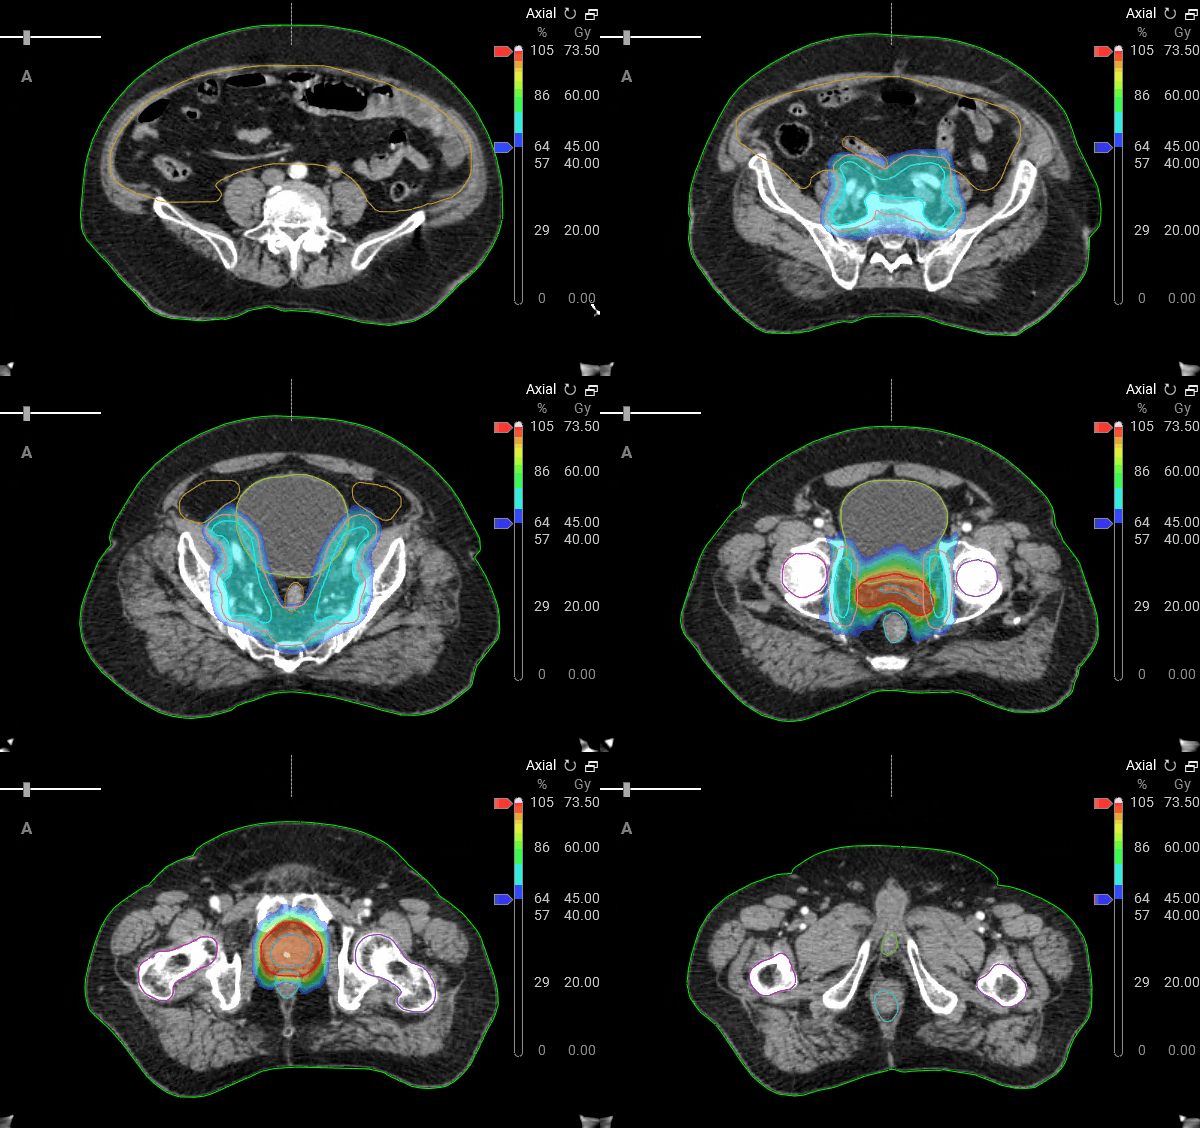
Prostate and lymph nodes 70/50.4Gy (NRG GU009 / COMPPARE)
Treatment Monitor
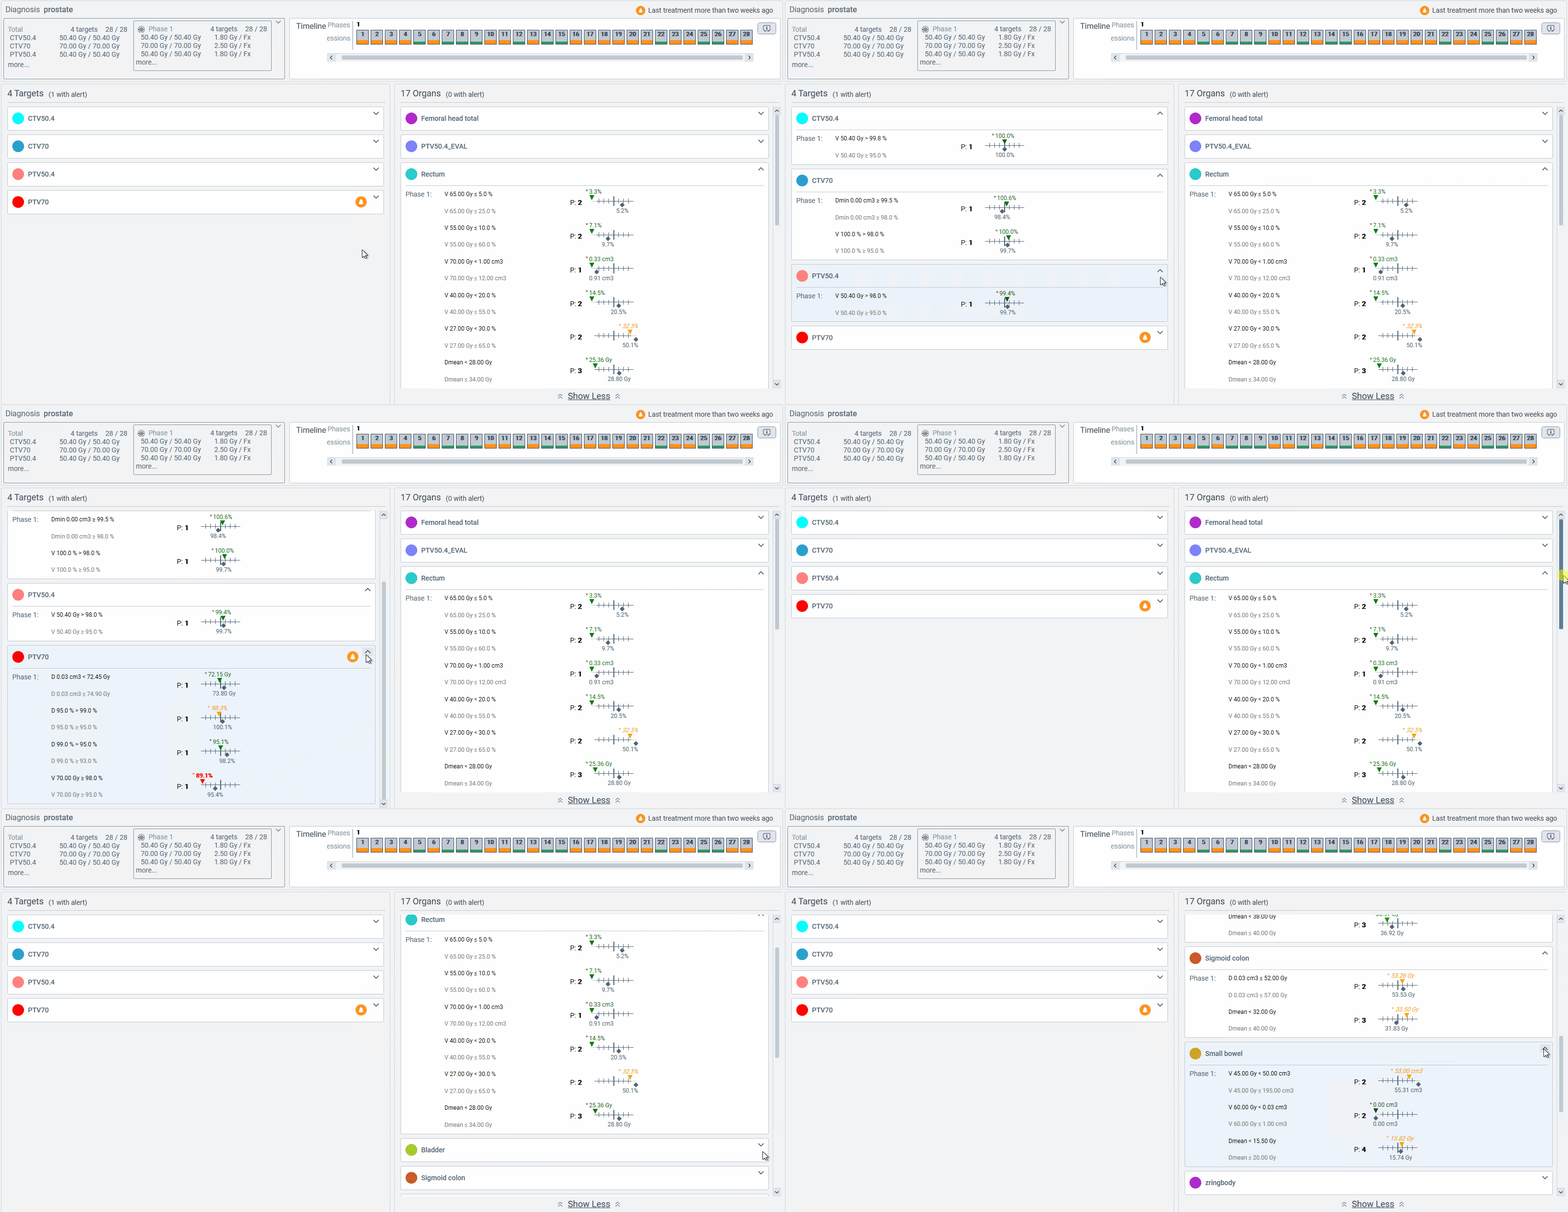 |
This image shows the user reviewing each clinical goal after the course of treatment. The targets are shown in the left column and the normal tissue structures on the right. The values highlighted in green represent exceeding, yellow as variation, and red as failing for the evaluation of each clinical goal.
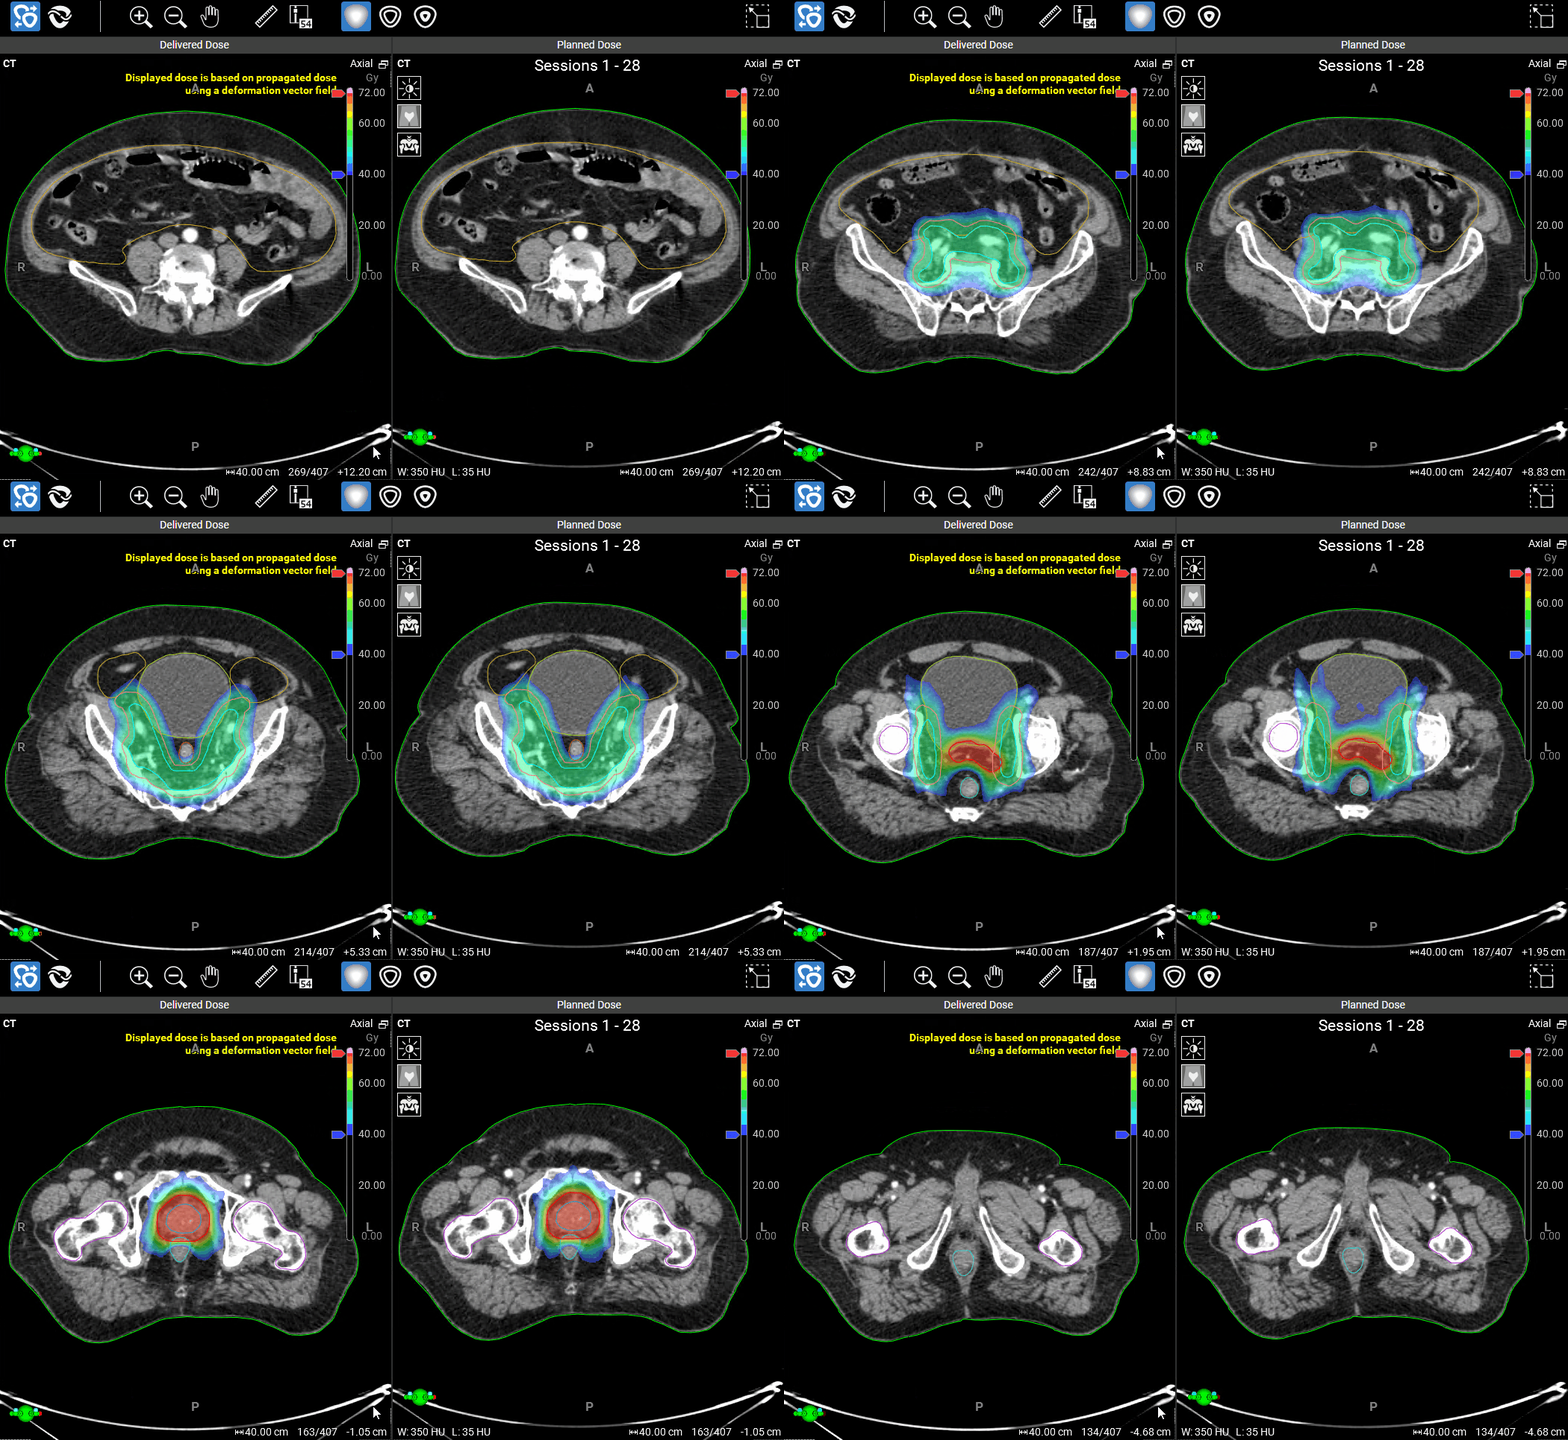 |
Clinicians have the option to monitor the delivered dose that is propagated via a deformation vector field during the course of treatment and compare it to the planned dose.
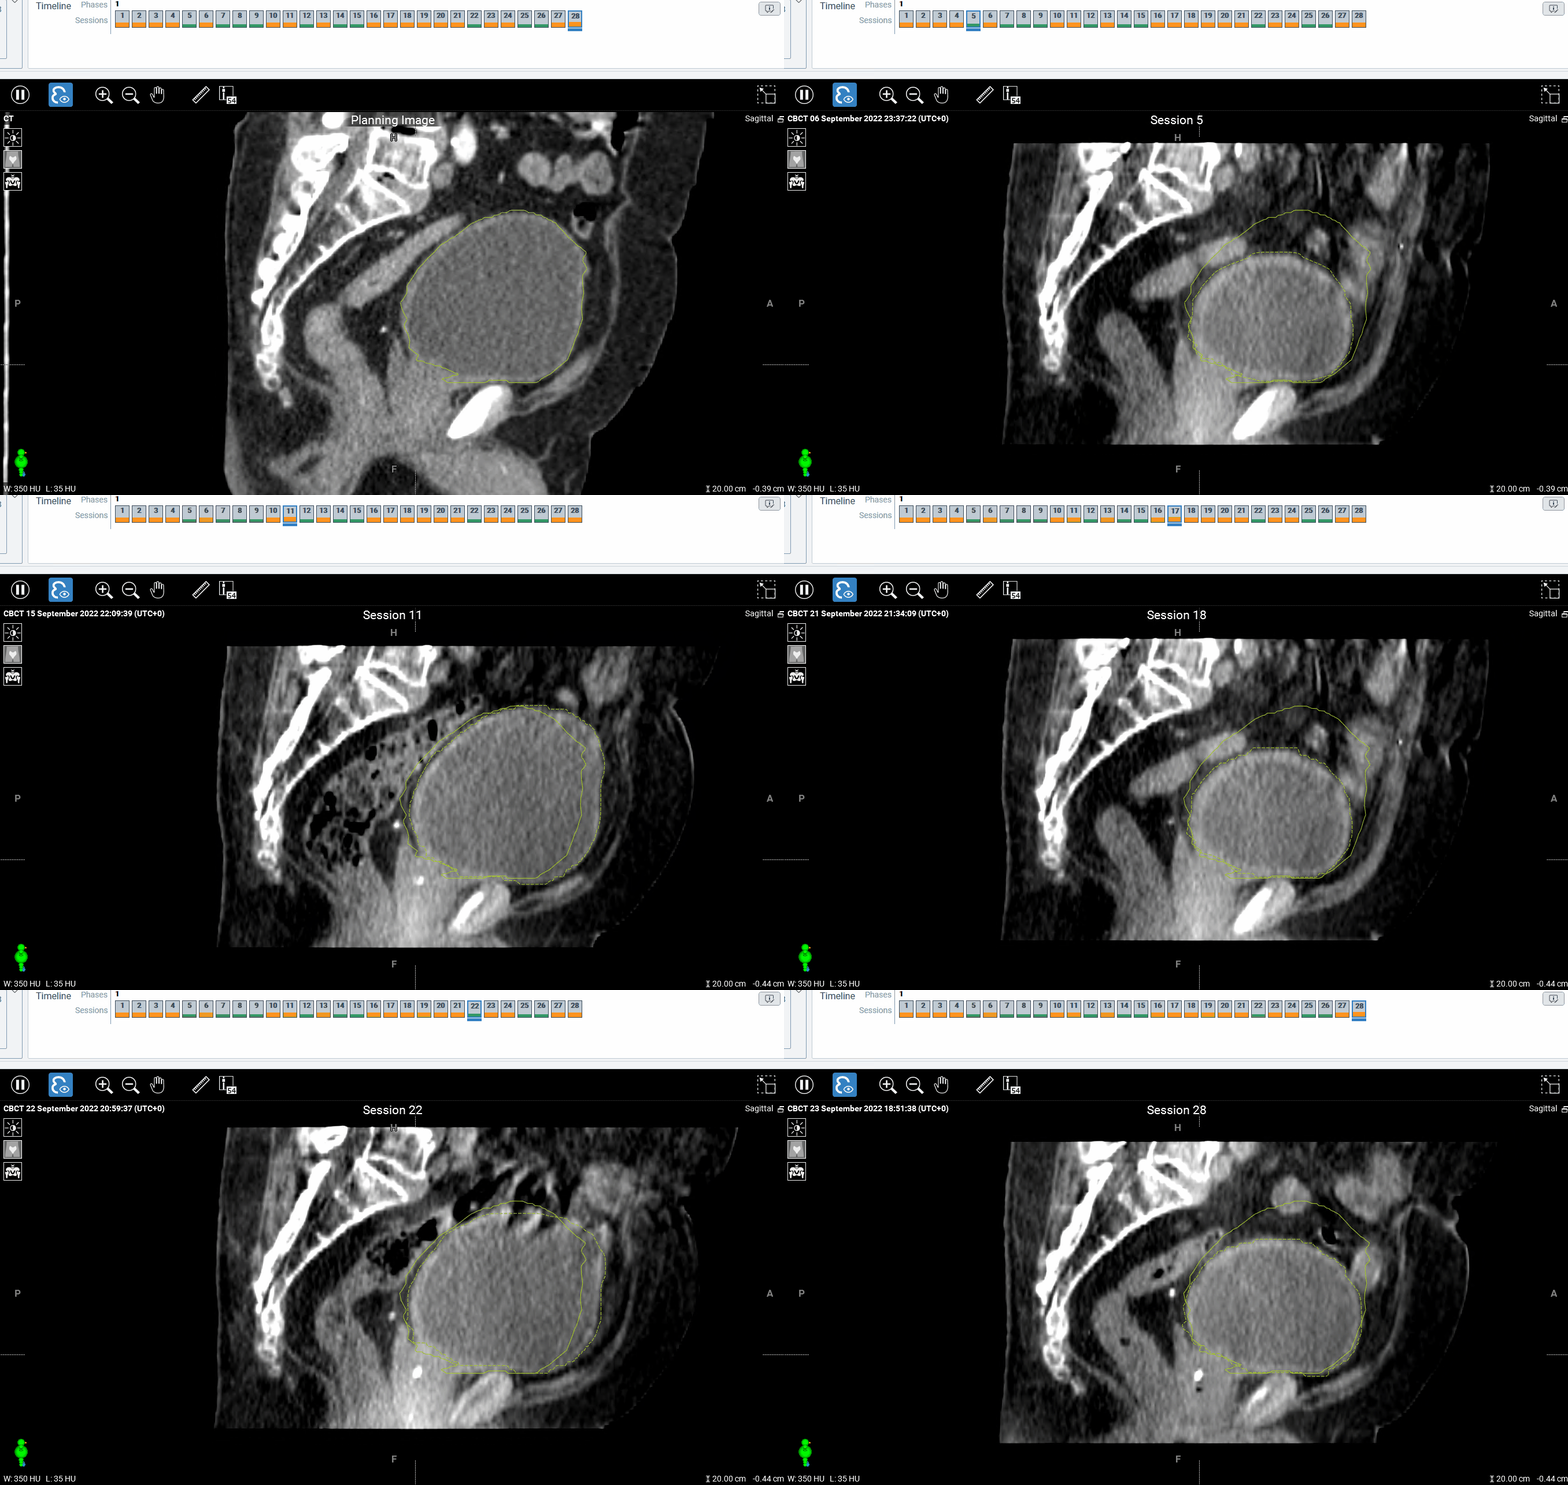 |
Each target and normal structure contour can be reviewed for each treatment session. In this example, the change in bladder volume is shown on each session kV-CBCT. The bladder volume used for the reference plan is displayed as a solid line and the dotted line for the change in volume for each session.
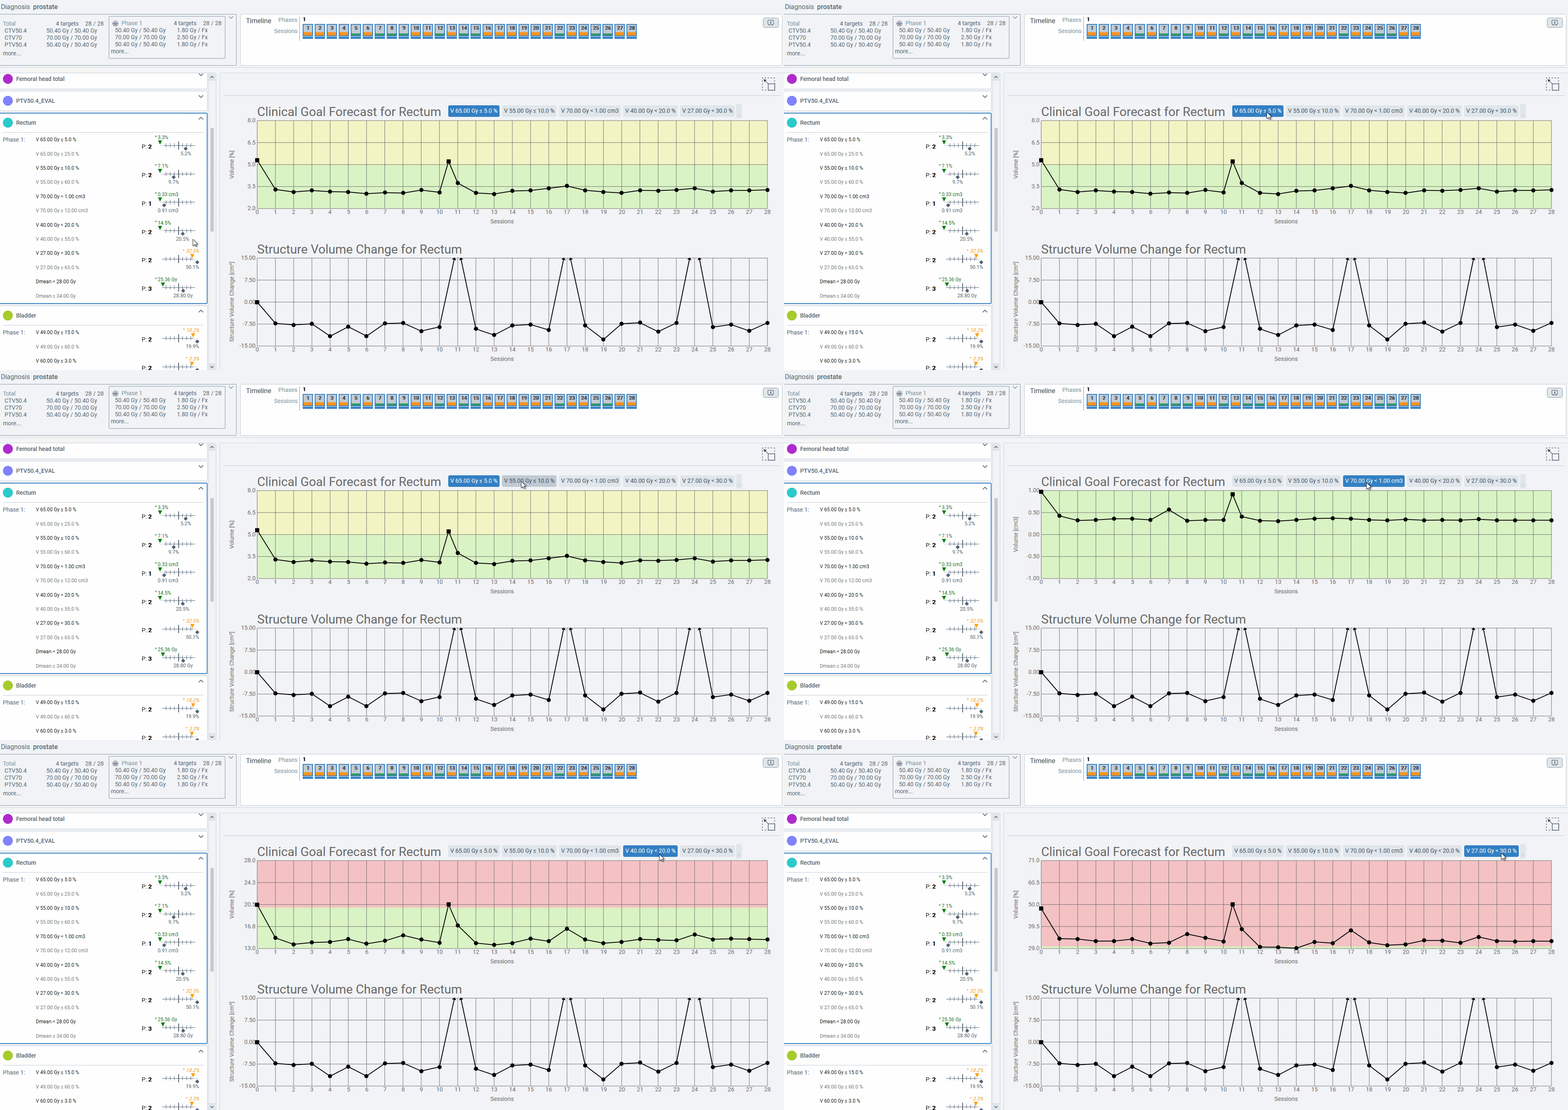 |
Clinicians can review trends and forecasts for each clinical goal and the how the structure volumes change throughout the treatment course. In this example, the user is reviewing the clinical goal trends for the rectum after the course of treatment.
|
Ethos treatment plan report |
Download associated |
DICOM patient export |
|
|
|
Any reference to a "plan study" are simply what the organizers call each case and may not be a "study" in the FDA sense as they may not have been published in a peer reviewed journal.
Varian does not provide medical advice and these are illustrative examples only.
Leading plans by expert planner. Your results may vary.
FOR EDUCATIONAL AND SCIENTIFIC EXCHANGE ONLY – NOT FOR SALES OR PROMOTIONAL USE.
